Using Excel to Write SPSS Syntax
IBM SPSS Statistics and Microsoft Excel are the tools perfectly complementing each other. We use Excel files for import and export data to/from SPSS, export end editing SPSS output. In this post we consider a small hint actively used by some SPSS users to automate syntax developing with the help of Excel.
It happens quite often that you’ve got a metadata (data describing the data, like labels, bounds for categorization, etc.) in a structured form in Excel. Suppose, you need to write a syntax which exploits this metadata in its specification. I.e., you need to “wrap” Excel file contents into SPSS syntax. Here are some cases of this kind:
- Excel
contains list of variable names and list of variable labels. Need to create
syntax to assign labels to corresponding variables, i.e.
VARIABLE LABELSsyntax; - Excel
contains old and new variable names. Need to create syntax to rename variables
in a dataset;
- Excel
contains values of a categorical variable and value labels. Need to assign
labels to values via syntax (
VALUE LABELScommand); - Excel
contains list of ranges (boundaries) to categorize some continuous variable,
corresponding categories’ values, and labels. Need to develop a syntax to
compute and describe new categorical variable based on specified ranges.
How can one solve these tasks? The first impulse might be simply to paste data from Excel to SPSS Syntax Editor and “convert” it to the syntax manually. But with numerous variables, values or rules to process, it might be tedious to wrap it manually line by line with appropriate formatting (slashes, quotes, instructions and keywords) to get the desired valid syntax.
Happily, with help of concatenation function in Excel one can automate syntax creation, so that almost no manual parsing will be required. Next example shows how the single=CONCATENATE() function helps us to
assign labels to the long list (hundreds or thousands) of values. The example
is made up from the syntax of assigning labels (names) to US counties’ FIPS
codes, see the original syntax here: http://spsstools.net/en/syntax/syntax-index/standard-data-files/create-labels-with-common-names-for-us-county-fips-codes/). How could we end up with such syntax if start
with lists of FIPS codes and county names in Excel file of the following form?
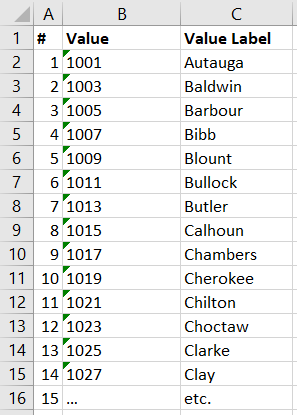
Figure 1. Value labels (original metadata) in Excel sheet
Let’s say
FIPS codes are stored in county
variable in SPSS. It would be a string variable, as we need to keep leading
zeros. Here how the target SPSS syntax should look like:
VALUE LABELS county
    '01001' 'Autauga'
    '01003' 'Baldwin'
    ‘last code’ ‘last label’.
To
quickly create the “core” of this syntax, let’s place to the next column (D) in
Excel the following formula:
=CONCATENATE(" '";B2;"' '";C2;"'")
(you may
notice at the screenshot below the name of this function in Russian =СЦЕПИТЬ() as I didn’t find how to avoid
this in localized Excel interface)
The meaning of this formula is to create a new string, by concatenation of the following pieces:
- 4
spaces (this is not really necessary, just for visual indent to make syntax
look prettier).
- Single
quote. Note that spaces and the quote are all quoted in double quotes to ensure
Excel treat them as a string value.
- Code
value from
B2cell. - Single
quote, then space, and another single quote. To SPSS that will mean as closing
quotation of code value and starting quotation of the corresponding county name.
- The
content of the
C2value (county name). - Finally,
another single quote, to end the specification of the label.
Note that we separate concatenated portions with semicolon, according to Excel functions’ arguments specification.
As we
finished with specification of the formula in D2 cell, the following result
appears:
‘1001’ ‘Autauga’
We need now to drag formula to the last used row in Excel sheet. This could be done quickly, regardless of how many such labels or names we have. Excel will automatically substitute cell references in the formula while coping it. The result will be like this:
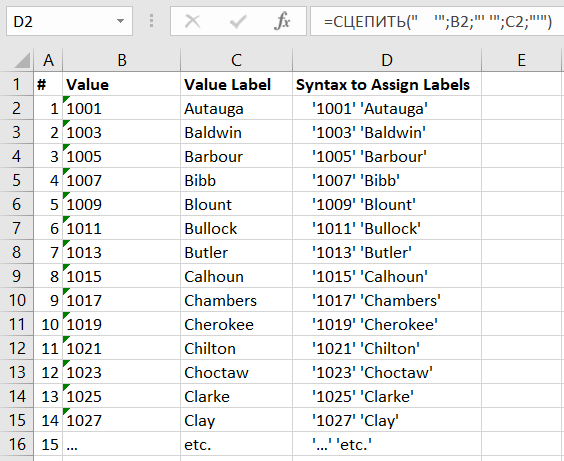
Figure 2. Original value labels in Excel sheet wrapped to the SPSS syntax definitions of value labels with help of CONCATENATE formula
Now copy
all the created rows from column D (starting with the second row), and paste
them into SPSS Syntax Editor.
Prepend
pasted code with VALUE LABELS county string (ensure you don’t have extra line
between VALUE LABELS county and lines with codes.
.) to end syntax
command properly. Now your VALUE LABELS command is ready to run. Again, here
how the final command should look like:
VALUE LABELS county
    '01001' 'Autauga'
    '01003' 'Baldwin'
    '01005' 'Barbour'
    '01007' 'Bibb'
    '01009' 'Blount'
    '01011' 'Bullock'
    '01013' 'Butler'
    '01015' 'Calhoun'
    '01017' 'Chambers'
    '01019' 'Cherokee'
    '01021' 'Chilton'
    '01023' 'Choctaw'
    '01025' 'Clarke'
    '01027' 'Clay'.
After running this command you may check the values were correctly assigned to the target variable:
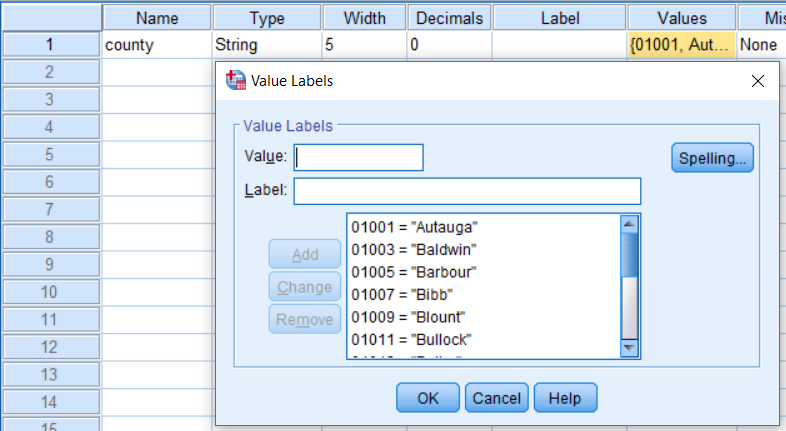
Figure 3. Value labels declared in Data Editor of SPSS (Variable View)
That’s it.
To review:
- We have started with some metadata,
organized in a structured way in Excel.
- We have demonstrated how to create
valid syntax from this metadata with help of Excel functions (here we used
=CONCATENATE(), but you may encounter situations where it might be useful to utilize other functions as well) - There are 3 steps to reach it: 1 – enter formula
to create syntax portion from one row, 2 – drag the formula to create syntax
for remaining rows, and 3 – paste the resulting rows to SPSS, optionally
prepending and/or postpending them to make SPSS command syntax finished.
The bonus to this “Excel-powered” approach of syntax development is the nice “interface” or codebook to edit the syntax. Changing any variable name, value or label in Excel data will update the result of concatenation formula. So that you’ll have the ready updated syntax to paste into SPSS right after making any modification to metadata. -